Next >>
On the World Environment Day, we decided to show data from The World Bank (TWB onwards) in its report «Recipe for a Livable Planet», which we recommend reading. We understand that data on this report is not yet corrected and TWB recommends not to use it for citation. Still, we do it anyway because it is a clear and important direction in which investments must be aligned to achieve net zero emissions by 2050.
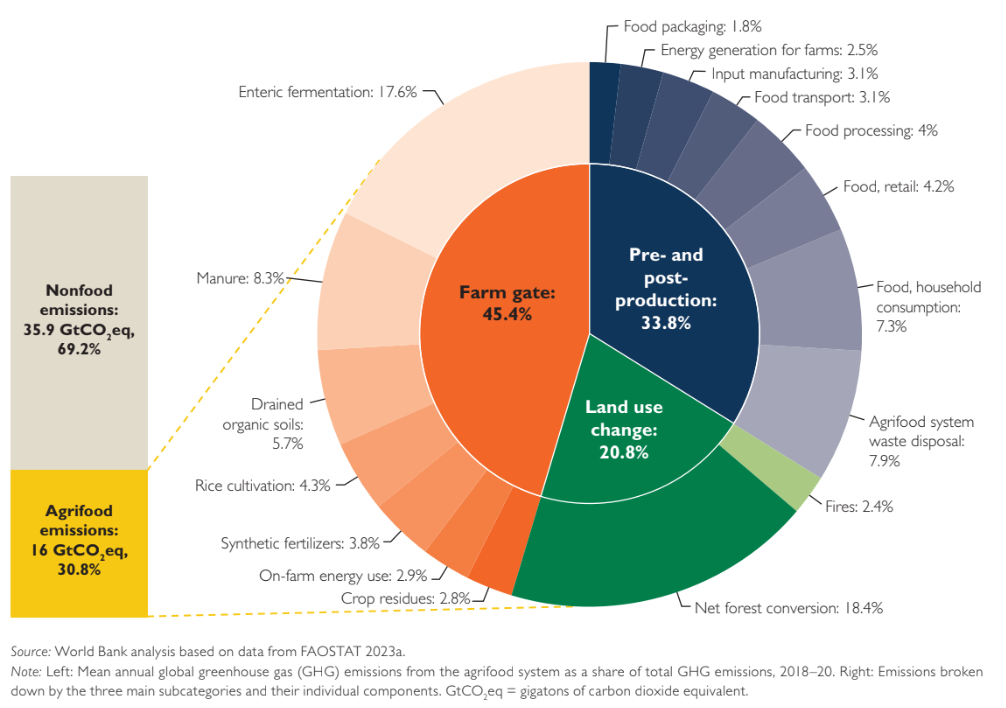
As TWB mentions, the Agrifood System is a much bigger contributor to climate change than many think. It generates almost a third of all GHG emissions, even more than all the world’s heat and electricity emissions. It might have been overlooked because people could have thought that changing such traditional industries was harder than changing others, in which technologies were more advanced. However, to accomplish net zero emissions by 2050, agrifood producers must change their production systems, there is no way out. TWB made a great analysis in identifying the source of the emissions and where can we find cost-effective opportunities.
In the graph below, they break down the food system emissions in each stage and type of produce. We can observe how animal production (enteric fermentation and manure) represents more than a quarter of the agrifood emissions, followed by deforestation (net forest conversion). Countries that have large animal production and big forests are a great target to mitigate this problematic.
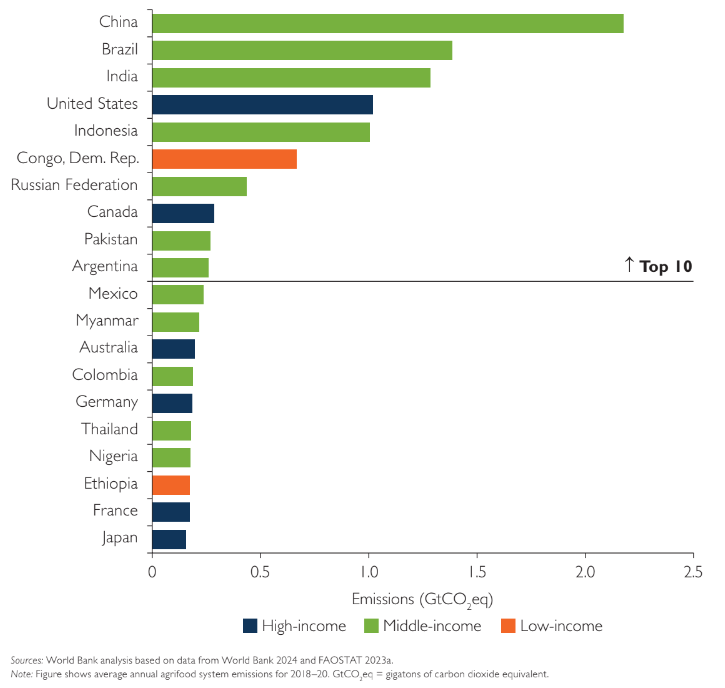
To identify origins and opportunities, TWB breaks the analysis into three sources: High-Income Countries (HICs), Middle-Income Countries (MICs), and Low-Income Countries (LICs). Having said this, analysts show in the following figure that 7 of the top 10 emitters are MICs. Despite this being true, there is a huge correlation with the size of productive land each country has. Australia is the 6th largest country in the World but, as it is a huge desert, its agrifood system is quite small compared to its dimension. On the contrary, the Democratic Rep. of Congo and Indonesia are number 11th and 15th in size, but their land is fertile all along the countries.
Having shared the origins of the emissions, now we proceed to show the opportunities that TWB exposes in its report. In the next image, TWB identifies cost-effective opportunities to cut or mitigate emissions in countries. There is a huge potential in changing the type of agriculture that is being done to others that sequester carbon from the atmosphere (in green). Then, protecting and restoring forests and other ecosystems. This is why the European Union dictated the regulation of deforestation-free products, to protect forests from being destroyed to produce food and commodities.
In addition to FDA – La Administración de Alimentos y Medicamentos Traceability compliance, at Darwin Evolution our north is to develop a technology to measure products’ environmental impact and showcase that information to final consumers. For this, we need to develop and group different technologies. First, to trace products through the whole value chain to identify where ingredients come from and where they ended up. Second, to measure carbon, pesticides, water, and fertilizers footprints and give products and companies a score. Finally, simply share all this information using QR codes in packaging. As a result, consumers will be able to scan QR codes on the same products and choose companies whose values are aligned with their own.
Our product is thought to be flexible to adapt to the needs of each company. We will have standard solutions for smaller businesses, understanding that technologies sometimes leave their cases apart, and more customized solutions for larger companies whose processes are more complicated.